
NEW RELEASE · RETAILER PERFORMANCE REPORT

Amazon Category Performance

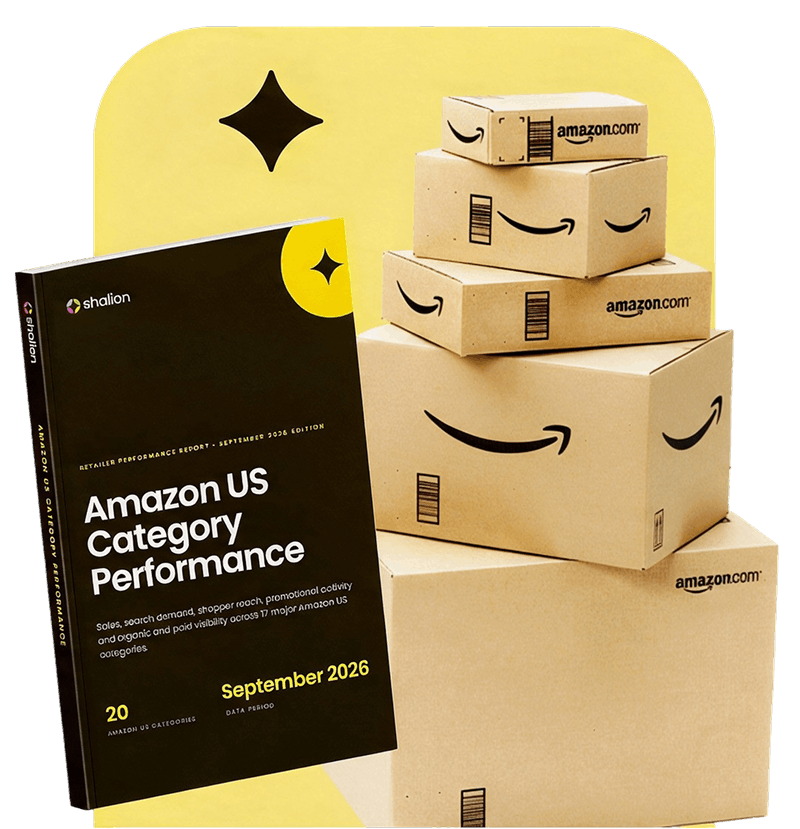
Sales, search demand, promotional activity and organic and paid visibility across 20 Amazon US categories. September 2026 report, covering 1 to 30 September 2026.

Download the report
amazon-category-report-september-2026-hero-image
 
 
Artboard 1
Asset 22
Every month we measure what actually happened on the Amazon US shelf: which brands took category share, which keywords pulled the most shopper impressions, who ran promotions, and who held organic and paid visibility.
 
The September 2026 report covers 20 categories, one page each, built on the same six blocks. Read your own category in a minute, then compare it against any other in the report.
 
The data comes from Retail Media Maestro, Shalion's retail media intelligence product, which tracks more than 500,000 keywords daily across major US retailers. Every figure is collected and derived by Shalion, independently of the retailer.
 
A category is published only once its underlying data meets our completeness bar, which is why this edition covers 20 categories rather than the full Amazon US tree. The list evolves with each edition.
Download the report

What's on every category page

brown-icon_win

Top brands by category share

Estimated category share distribution for the top five brands in the category.

brown-icon_report

Top Searched Category Keywords

The keywords from the selected category generating the most shopper impressions, meaning the estimated times that products from the category reached shoppers in search results with their category relevance and the average selling price of the products shown.

brown-icon_bar-graph

Estimated Shopper Impressions

Estimated times category items reached shoppers in search results, split into organic and paid. Shown for the category as a whole and for each top-selling item.

brown-icon_calendar

Placements with promo

Deals, coupons, promotional badges and price reductions observed on brand items across the period.

brown-icon_pie-chart

Organic and Paid Share of Voice

Number of placements of the brand over the total number of placements from search results. Shalion calculates this as Weighted Share of Voice, so appearances are weighted by rank, size, above the fold, promotions and video, reflecting real consumer scrolling behaviour. It is reported separately for paid (ads) and organic.

brown-icon_trophy

Top-Selling Items

The top products by category share in the selected period, with their average price, rating and organic and paid shopper impressions. This report shows the ten highest per category.

Why brands read it

Sales, visibility and promotional activity are measured on the same tracked universe and shown side by side, so a brand's category share can be read against the visibility and promotional weight behind it. Organic and paid share of voice are reported separately rather than collapsed into a single number.

Every figure is collected and derived by Shalion, with no retailer bias and no holding company conflicts. The same measurement runs daily on Walmart, Target and Kroger.

The report is a benchmark. Diagnosis, prioritisation and recommended actions sit in Shalion Maestro.

Download the report
amazon-category-performance-october_ebook-asset-1 (1)

Categories in this edition

Appliances Arts, Crafts & Sewing Automotive Baby Products Beauty and Personal Care Cell Phones and Accessories Clothing, Shoes & Jewelry Electronics Grocery and Gourmet Food Health and Household Home and Kitchen Industrial and Scientific Musical Instruments Office Products Patio, Lawn and Garden Pet Supplies Sports and Outdoors Tools & Home Improvement Toys and Games Video Games


AT A GLANCE

Amazon US category performance, September 2026

Total, organic and paid shopper impressions, leading brand by category share, and the highest-impression keyword for each of the 20 Amazon US categories covered in this edition. Figures cover 1 to 30 September 2026 and come from Shalion's Retail Media Maestro.

Category Total shopper impressions Organic Paid Leading brand by category share Highest-impression keyword
Appliances 177.7M 109.8M 67.9M GE (7.55%) ice maker
Arts, Crafts & Sewing 2.3B 1.4B 910.8M Elmer's (2.02%) pencil case
Automotive 2.0B 1.2B 733.4M A-Premium (1.30%) car accessories
Baby Products 2.3B 1.5B 804.6M Momcozy (2.66%) baby essentials
Beauty and Personal Care 13.7B 8.8B 4.8B Dove (1.73%) magnetic eyelashes
Cell Phones and Accessories 2.2B 1.4B 815.4M Anker PowerHouse (3.19%) portable charger
Clothing, Shoes & Jewelry 2.9B 1.8B 1.1B Adidas (0.77%) umbrella
Electronics 5.2B 3.4B 1.8B Logitech (1.35%) backpack
Grocery and Gourmet Food 9.2B 6.5B 2.7B Amazon Grocery (9.55%) eggs
Health and Household 15.0B 9.9B 5.1B Amazon Basics (3.69%) paper towels
Home and Kitchen 19.7B 11.8B 7.8B Amazon Basics (1.67%) shower curtain
Industrial and Scientific 1.2B 779.0M 439.3M Uxcell (0.87%) toothpaste
Musical Instruments 383.8M 239.2M 144.6M D'Addario (1.56%) wall panels
Office Products 4.5B 2.8B 1.7B Amazon Basics (5.86%) highlighters
Patio, Lawn and Garden 3.3B 2.0B 1.2B Terro (2.04%) halloween decorations
Pet Supplies 3.2B 2.0B 1.2B Purina Fancy Feast (2.26%) cat litter
Sports and Outdoors 4.1B 2.5B 1.6B Broad Bay (1.22%) electric scooter
Tools & Home Improvement 4.8B 2.9B 1.9B Dewalt (1.02%) led lights
Toys and Games 5.4B 3.5B 1.9B Crayola (3.82%) squishy
Video Games 153.8M 100.6M 53.2M Nintendo (6.88%) switch 2


*How to cite this data: Shalion, Amazon US Category Performance, September 2026 (data period 1 to 30 September 2026). Retrieved from shalion.com.

Appliances
Total shopper impressions177.7M
Organic109.8M
Paid67.9M
Leading brand by category shareGE (7.55%)
Highest-impression keywordice maker
Arts, Crafts & Sewing
Total shopper impressions2.3B
Organic1.4B
Paid910.8M
Leading brand by category shareElmer's (2.02%)
Highest-impression keywordpencil case
Automotive
Total shopper impressions2.0B
Organic1.2B
Paid733.4M
Leading brand by category shareA-Premium (1.30%)
Highest-impression keywordcar accessories
Baby Products
Total shopper impressions2.3B
Organic1.5B
Paid804.6M
Leading brand by category shareMomcozy (2.66%)
Highest-impression keywordbaby essentials
Beauty and Personal Care
Total shopper impressions13.7B
Organic8.8B
Paid4.8B
Leading brand by category shareDove (1.73%)
Highest-impression keywordmagnetic eyelashes
Cell Phones and Accessories
Total shopper impressions2.2B
Organic1.4B
Paid815.4M
Leading brand by category shareAnker PowerHouse (3.19%)
Highest-impression keywordportable charger
Clothing, Shoes & Jewelry
Total shopper impressions2.9B
Organic1.8B
Paid1.1B
Leading brand by category shareAdidas (0.77%)
Highest-impression keywordumbrella
Electronics
Total shopper impressions5.2B
Organic3.4B
Paid1.8B
Leading brand by category shareLogitech (1.35%)
Highest-impression keywordbackpack
Grocery and Gourmet Food
Total shopper impressions9.2B
Organic6.5B
Paid2.7B
Leading brand by category shareAmazon Grocery (9.55%)
Highest-impression keywordeggs
Health and Household
Total shopper impressions15.0B
Organic9.9B
Paid5.1B
Leading brand by category shareAmazon Basics (3.69%)
Highest-impression keywordpaper towels
Home and Kitchen
Total shopper impressions19.7B
Organic11.8B
Paid7.8B
Leading brand by category shareAmazon Basics (1.67%)
Highest-impression keywordshower curtain
Industrial and Scientific
Total shopper impressions1.2B
Organic779.0M
Paid439.3M
Leading brand by category shareUxcell (0.87%)
Highest-impression keywordtoothpaste
Musical Instruments
Total shopper impressions383.8M
Organic239.2M
Paid144.6M
Leading brand by category shareD'Addario (1.56%)
Highest-impression keywordwall panels
Office Products
Total shopper impressions4.5B
Organic2.8B
Paid1.7B
Leading brand by category shareAmazon Basics (5.86%)
Highest-impression keywordhighlighters
Patio, Lawn and Garden
Total shopper impressions3.3B
Organic2.0B
Paid1.2B
Leading brand by category shareTerro (2.04%)
Highest-impression keywordhalloween decorations
Pet Supplies
Total shopper impressions3.2B
Organic2.0B
Paid1.2B
Leading brand by category sharePurina Fancy Feast (2.26%)
Highest-impression keywordcat litter
Sports and Outdoors
Total shopper impressions4.1B
Organic2.5B
Paid1.6B
Leading brand by category shareBroad Bay (1.22%)
Highest-impression keywordelectric scooter
Tools & Home Improvement
Total shopper impressions4.8B
Organic2.9B
Paid1.9B
Leading brand by category shareDewalt (1.02%)
Highest-impression keywordled lights
Toys and Games
Total shopper impressions5.4B
Organic3.5B
Paid1.9B
Leading brand by category shareCrayola (3.82%)
Highest-impression keywordsquishy
Video Games
Total shopper impressions153.8M
Organic100.6M
Paid53.2M
Leading brand by category shareNintendo (6.88%)
Highest-impression keywordswitch 2


*Shalion, Amazon US Category Performance, September 2026 edition (data period 1 to 31 August 2026). Retrieved from shalion.com.

Not seeing your category?

Tell us which one you need and we will include it in the next edition.


FAQ
Six questions written the way people actually ask assistants, each answered in the first sentence.

Amazon Grocery held the largest single-brand category share of any category Shalion tracked in September 2026, at 9.55% of the Grocery and Gourmet Food category on Amazon US, followed by GE at 7.55% of Appliances.


What you'll learn

Asset 9-1
Which brands took category share in your category last month, and which products carried it
Asset 9-1
Which keywords moved the most shopper impressions, and how closely they map to your category
Asset 9-1
How organic and paid share of voice was distributed across the leading brands
Asset 9-1
Which brands recorded the most promotional placements in the category

Download the free "Amazon Category Performance" report

(20 categories, one page each, September 2026 data)

Download the report

WHO READS THIS

Built for the 
people who own the number

If your day involves winning and defending accounts on category performance, tracking where your brands rank on Amazon, or explaining to senior stakeholders how a category moved last month, this report was written for you.


In Agencies
Account directors
Retail media managers
Insights analysts
New business leads

In Brands
Amazon channel managers
eCom directors
Category leads
Insights and analytics leads

ABOUT THE AUTHOR

Shalion-Team-Inez

Inés Alegre | VP of Product

Product is one of the most exciting areas to be at Shalion! Always innovating, incorporating new features, and thinking about ways to push our product further and create more value for the brands and retail media agencies we serve.

GET THE REPORT

Read the full 25-page report | Free to download | Everything inside 

→ Estimated category share for the leading brands across 20 Amazon US categories
 
→ Organic and paid shopper impressions for every category and for each of its ten top-selling items
 

→ The ten highest-impression keywords in every category, with category relevance and average selling price

→ Organic and paid share of voice reported separately, never merged into a single number

→ Placements with promo by brand, from the 525,403 recorded by Whole Foods Market in Grocery and Gourmet Food down to the long tail

→ The ten top-selling items per category, with price, rating and brand

→ Full methodology: what is estimated, what is observed, and what is excluded

More free reports

New editions publish in the first week of every month.

Browse all reports
amazonhero (2)